

A multiplication chart 1-20 is a 20×20 grid that shows every product from 1 × 1 up to 20 × 20 = 400. It has 400 cells but only 210 unique facts, because the grid mirrors itself across a diagonal of perfect squares.
Younger students use it to learn times tables beyond 12. Older learners use it for factoring, fractions, and fast mental math.
In this guide, you'll get the full chart, my favorite tricks for the tough tables, and a plan backed by research to memorize tables 1 to 20.
Let's get started.
The Complete Multiplication Chart 1-20
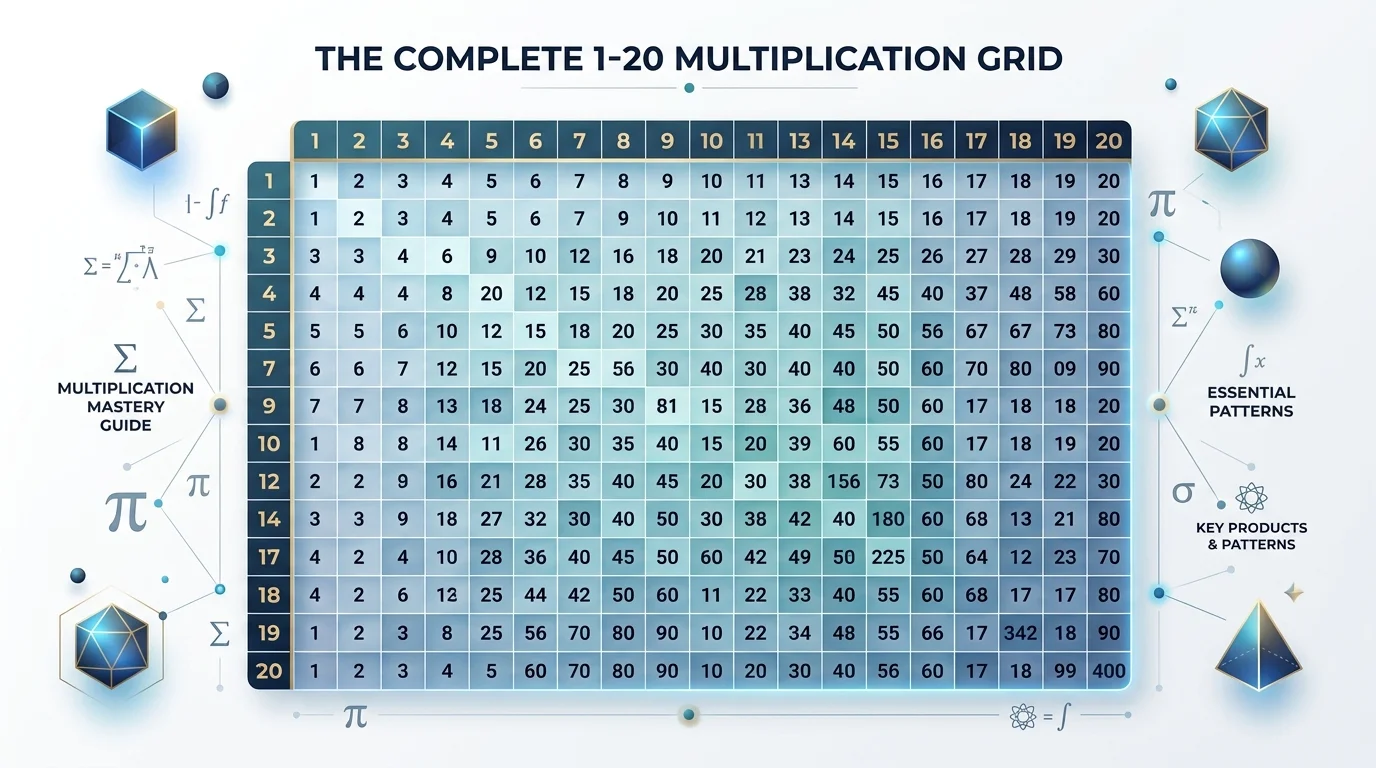
Here it is: the full 20x20 multiplication chart, ready to use right now.
To find any answer, pick a number in the left column and a number in the top row. The answer sits where they meet. I've bolded the perfect squares on the diagonal so you can spot them instantly.
Bookmark this page for quick lookups. Or print it out and keep a copy on your wall, desk, or binder.
Show Image
× | 1 | 2 | 3 | 4 | 5 | 6 | 7 | 8 | 9 | 10 | 11 | 12 | 13 | 14 | 15 | 16 | 17 | 18 | 19 | 20 |
|---|---|---|---|---|---|---|---|---|---|---|---|---|---|---|---|---|---|---|---|---|
1 | 1 | 2 | 3 | 4 | 5 | 6 | 7 | 8 | 9 | 10 | 11 | 12 | 13 | 14 | 15 | 16 | 17 | 18 | 19 | 20 |
2 | 2 | 4 | 6 | 8 | 10 | 12 | 14 | 16 | 18 | 20 | 22 | 24 | 26 | 28 | 30 | 32 | 34 | 36 | 38 | 40 |
3 | 3 | 6 | 9 | 12 | 15 | 18 | 21 | 24 | 27 | 30 | 33 | 36 | 39 | 42 | 45 | 48 | 51 | 54 | 57 | 60 |
4 | 4 | 8 | 12 | 16 | 20 | 24 | 28 | 32 | 36 | 40 | 44 | 48 | 52 | 56 | 60 | 64 | 68 | 72 | 76 | 80 |
5 | 5 | 10 | 15 | 20 | 25 | 30 | 35 | 40 | 45 | 50 | 55 | 60 | 65 | 70 | 75 | 80 | 85 | 90 | 95 | 100 |
6 | 6 | 12 | 18 | 24 | 30 | 36 | 42 | 48 | 54 | 60 | 66 | 72 | 78 | 84 | 90 | 96 | 102 | 108 | 114 | 120 |
7 | 7 | 14 | 21 | 28 | 35 | 42 | 49 | 56 | 63 | 70 | 77 | 84 | 91 | 98 | 105 | 112 | 119 | 126 | 133 | 140 |
8 | 8 | 16 | 24 | 32 | 40 | 48 | 56 | 64 | 72 | 80 | 88 | 96 | 104 | 112 | 120 | 128 | 136 | 144 | 152 | 160 |
9 | 9 | 18 | 27 | 36 | 45 | 54 | 63 | 72 | 81 | 90 | 99 | 108 | 117 | 126 | 135 | 144 | 153 | 162 | 171 | 180 |
10 | 10 | 20 | 30 | 40 | 50 | 60 | 70 | 80 | 90 | 100 | 110 | 120 | 130 | 140 | 150 | 160 | 170 | 180 | 190 | 200 |
11 | 11 | 22 | 33 | 44 | 55 | 66 | 77 | 88 | 99 | 110 | 121 | 132 | 143 | 154 | 165 | 176 | 187 | 198 | 209 | 220 |
12 | 12 | 24 | 36 | 48 | 60 | 72 | 84 | 96 | 108 | 120 | 132 | 144 | 156 | 168 | 180 | 192 | 204 | 216 | 228 | 240 |
13 | 13 | 26 | 39 | 52 | 65 | 78 | 91 | 104 | 117 | 130 | 143 | 156 | 169 | 182 | 195 | 208 | 221 | 234 | 247 | 260 |
14 | 14 | 28 | 42 | 56 | 70 | 84 | 98 | 112 | 126 | 140 | 154 | 168 | 182 | 196 | 210 | 224 | 238 | 252 | 266 | 280 |
15 | 15 | 30 | 45 | 60 | 75 | 90 | 105 | 120 | 135 | 150 | 165 | 180 | 195 | 210 | 225 | 240 | 255 | 270 | 285 | 300 |
16 | 16 | 32 | 48 | 64 | 80 | 96 | 112 | 128 | 144 | 160 | 176 | 192 | 208 | 224 | 240 | 256 | 272 | 288 | 304 | 320 |
17 | 17 | 34 | 51 | 68 | 85 | 102 | 119 | 136 | 153 | 170 | 187 | 204 | 221 | 238 | 255 | 272 | 289 | 306 | 323 | 340 |
18 | 18 | 36 | 54 | 72 | 90 | 108 | 126 | 144 | 162 | 180 | 198 | 216 | 234 | 252 | 270 | 288 | 306 | 324 | 342 | 360 |
19 | 19 | 38 | 57 | 76 | 95 | 114 | 133 | 152 | 171 | 190 | 209 | 228 | 247 | 266 | 285 | 304 | 323 | 342 | 361 | 380 |
20 | 20 | 40 | 60 | 80 | 100 | 120 | 140 | 160 | 180 | 200 | 220 | 240 | 260 | 280 | 300 | 320 | 340 | 360 | 380 | 400 |
What Is a Multiplication Chart 1-20?
A multiplication table 1 to 20 is a reference grid that lists the product of every number pair from 1 to 20.
That sounds simple. But once you understand how the grid is built, you'll notice it's packed with patterns. And those patterns are exactly what make memorizing it so much easier than most people expect.
Here's what's inside:
400 cells, with 400 as the largest product (20 × 20).
20 perfect squares running down the diagonal, from 1 to 400.
A mirror image across that diagonal, thanks to the commutative property of multiplication (7 × 13 = 13 × 7).
The best part?
That symmetry means you only need to learn 210 unique facts, not 400.
20x20 vs 12x12: Which Multiplication Chart Do You Need?
Not every learner needs a 20×20 grid on day one.
In fact, picking the wrong size can overwhelm a beginner or bore an advanced student. So I've put every common chart size side by side below. Just find the row that matches your grade level and goals, and you'll know exactly which chart to use. Then you can level up whenever you're ready.
Chart Type | Products Up To | Unique Facts | Best For | Typical Level |
|---|---|---|---|---|
10×10 | 100 | 55 | Learning first facts | Grades 2 to 3 |
12×12 | 144 | 78 | UK Year 4 check, US review | Grades 3 to 4 |
15×15 | 225 | 120 | Bridging to bigger numbers | Grades 4 to 6 |
20×20 | 400 | 210 | Fractions, algebra, exam prep | Grade 5+ |
Just starting out? Focus on the top left 10×10 corner of the chart above first.
Want to test yourself? Print a blank grid and fill it in from memory.
The 20×20 grid is especially useful for older students. For example, one high school teacher at Math = Love gives her students this chart for algebra work. They use it for factoring quadratics and for finding the lowest common denominator of two fractions.
What the Curriculum Expects (2026 Update)
Here's something most parents don't realize.
Different countries set very different targets for times tables 1-20. Knowing where the official bar sits helps you decide how far to push. It also shows why learning up to 20 gives you such a big advantage over students who stop at 10 or 12.
Country | Tables Expected | Deadline | Assessment |
|---|---|---|---|
United States | All single digit products from memory | End of Grade 3 | Common Core 3.OA.C.7 |
England | Up to 12 × 12 | End of Year 4 | Multiplication Tables Check |
India / South Asia | Often up to 20 | Primary grades | School tests |
In England, recall is improving:
In 2025, the national average score on the check was 21.0 out of 25, up from 20.6 in 2024.
37% of pupils scored full marks, and that was also the most common score.
The average has risen every year since 2022, when it was 19.8.
How to Read a Multiplication Chart 1-20 (Step by Step)
Reading the chart takes about ten seconds to learn.
After a few tries, your eyes will jump straight to the right cell without thinking. Let's walk through it together with a real example: 13 × 15. Follow these four steps, and you'll be able to find any product on the grid in seconds.
Find your first number (the multiplicand) in the left column. Here, that's 13.
Find your second number (the multiplier) in the top row. That's 15.
Slide across and down until the row and column meet.
Read the answer: 195.
Pro tip: a colored chart that highlights multiples of 5 and 10 makes these lookups even faster.
Times Table Tricks for 11 to 20
Let's be honest: the higher tables look scary.
Numbers like 17 and 19 feel random at first. But here's the secret. The multiplication tables 11 to 20 follow patterns that are just as predictable as the lower ones. Once you know where to look, you'll solve them faster than you ever expected.
Spot the Units Digit Patterns
Every table leaves a "fingerprint" in its last digit.
Once you notice these repeating cycles, you can double check any answer in a split second. That's a real confidence booster during tests. Better yet, these patterns work as a built in error detector for your mental math.
The 15 times table always ends in 5 or 0, alternating.
The 16 times table cycles through 6, 2, 8, 4, 0.
The 18 times table cycles through 8, 6, 4, 2, 0.
Break Big Tables Into Small Ones
This is my favorite trick. Period.
Instead of memorizing big facts from scratch, you split one hard problem into two easy ones. This uses the distributive property, and it works on every table from 11 to 20. Students taught with strategies like this improved their fluency more consistently than students who only used drills.
12 × n = (10 × n) + (2 × n)
15 × n = (10 × n) + (5 × n)
19 × n = (20 × n) − n
Bonus: breaking a big problem into smaller parts is a core habit behind strong critical thinking skills, so you're training more than just multiplication here.
Quick Example: 17 × 6
Let's put this trick to work.
Say you blank on 17 × 6 during a quiz. Don't panic. Split 17 into 10 and 7, multiply each part by 6, and add the results. It takes about five seconds, and you'll get it right every single time.
10 × 6 = 60
7 × 6 = 42
60 + 42 = 102
Perfect Squares from 11 to 20
The diagonal of your chart hides some of the most useful numbers in math.
These squares show up constantly in area problems, algebra, and square roots. So memorizing just these ten facts gives you a huge return for very little effort. Here they are in one quick reference.
Number | 11 | 12 | 13 | 14 | 15 | 16 | 17 | 18 | 19 | 20 |
|---|---|---|---|---|---|---|---|---|---|---|
Square | 121 | 144 | 169 | 196 | 225 | 256 | 289 | 324 | 361 | 400 |
3 Common Multiplication Mistakes (and How to Fix Them)
Even strong students slip up on these.
The good news? Most errors follow predictable patterns, so they're easy to fix once you know what to watch for. Researchers have studied these mistakes closely, and the fixes below target exactly where the brain tends to get confused.
Grabbing a "neighbor" answer. Children often give an answer from a nearby fact in the same table, like saying 4 × 6 = 28 (28 belongs to 4 × 7). Fix: Check the units digit using the patterns above.
Mixing up big neighbors. Facts like 17 × 8 (136) and 17 × 9 (153) blur together. Fix: Rebuild the answer with the split and add trick.
Leaning on the chart forever. The chart is a training tool, not a crutch. Fix: Cover one row each day and recall it from memory.
How to Memorize Tables 1 to 20 (What Research Says)
So what's the best way to actually remember all of this?
Good news: researchers have studied this question for decades. The winning formula mixes understanding, active recall, and low pressure practice. Chanting louder doesn't make the list. Here's the step by step plan I recommend, backed by real studies.
Master 1 to 10 first. Everything else builds on them.
Use skip counting. Counting by 13s or 17s turns each row into a pattern you can hear.
Practice with flashcards. In a 2023 classroom study, flashcard retrieval practice built stronger multiplication fact fluency than reciting tables aloud, both right away and a week later.
Ease off the stopwatch. Stanford's Jo Boaler reports that for about a third of students, timed tests are where math anxiety begins.
Keep sessions short and daily. Five focused minutes beats one exhausting hour.
Want even more memory techniques? These proven ways to memorize something fast work just as well for times tables as they do for vocabulary or exam notes.
Why does this balance matter?
The National Mathematics Advisory Panel found that understanding concepts, following procedures fluently, and recalling facts quickly and effortlessly all reinforce one another. In other words, number sense and memory work best as a team.
Who Should Use a Multiplication Chart 1-20?
Short answer: pretty much anyone who works with numbers.
This chart isn't just for kids learning their first facts. It helps you see how factors and multiples connect across the whole number system, and over time, the facts simply stick. Here's who gets the most value from keeping one close by.
Elementary students building a strong base beyond 12.
Middle and high schoolers working on fractions, prime numbers, and algebra.
Homeschool parents who want one reliable reference on the wall.
Teachers looking for a flexible classroom visual.
Competitive exam takers who need fast, accurate calculations.
Print Your Multiplication Chart 1-20
You've got the chart, the tricks, and the research.
But here's the thing: knowledge only sticks when you see it every day. A screen you have to open won't do that. A chart on your desk or wall will. That's why a printable multiplication chart 1-20 is the simplest upgrade you can make for faster, math without the stress.
Not all printable charts are equal, though. Here's what separates a helpful chart from a forgettable one:
Feature | Basic Chart | Well Designed Chart |
|---|---|---|
Full 20×20 grid | Sometimes | ✅ |
Highlighted perfect squares | ❌ | ✅ |
Multiples of 5 and 10 color coded | ❌ | ✅ |
Blank fill in version | ❌ | ✅ |
Color and black and white | Rarely | ✅ |
A4 and US Letter sizes | Rarely | ✅ |
So don't wait.
Print the chart above today, or grab a free color coded and blank version from Math = Love. Then start turning tough times tables into easy wins.
Frequently Asked Questions
Still have questions? You're not alone.
These are the questions parents, students, and teachers ask most often about the multiplication chart 1-20. Each answer is short and direct, so you can find what you need fast and get back to practicing. If your question isn't here, the sections above probably cover it in more detail.
How do you memorize tables 1 to 20 fast?
Start with tables 1 to 10, then learn 11 to 20 using patterns and the split and add trick, such as 17 × 6 = (10 × 6) + (7 × 6).
Practice with flashcards for five minutes a day instead of reciting aloud. Research shows active retrieval builds stronger recall that lasts longer than repetition alone.
Is it necessary to learn tables up to 20?
No curriculum requires it in the US or England. The US targets single digit facts by Grade 3, and England targets 12 × 12 by Year 4.
However, knowing tables to 20 speeds up fractions, percentages, algebra, and competitive exams. That's why many South Asian schools teach it.
What is 17 × 17?
17 × 17 = 289.
It's one of the perfect squares on the chart's diagonal. A quick way to check it: (17 × 10) + (17 × 7) = 170 + 119 = 289.
What are the perfect squares from 1 to 400?
The 20 perfect squares from 1 to 400 are: 1, 4, 9, 16, 25, 36, 49, 64, 81, 100, 121, 144, 169, 196, 225, 256, 289, 324, 361, and 400.
On a 20×20 chart, they run down the diagonal from the top left corner to the bottom right.
What is the hardest times table?
For tables up to 12, England's official check focuses most on the 6, 7, 8, 9, and 12 tables, because these were judged the most difficult.
Among tables 11 to 20, many learners find 17 and 19 toughest. The split and add trick makes both much easier.
How many facts are on a multiplication chart 1-20?
A 1-20 chart has 400 cells.
Because multiplication is commutative (7 × 13 = 13 × 7), there are only 210 unique facts to learn. That's barely half of what the grid first suggests.
What grade learns multiplication?
In the US, students start multiplication in Grade 2 or 3 and are expected to know all single digit facts by the end of Grade 3.
In England, pupils should know tables up to 12 × 12 by the end of Year 4, at around age 9.