
Learning how to read a balance sheet takes about 20 minutes once someone shows you the right order to read it in. A balance sheet reports what a company owns, what it owes, and what's left over for owners on one specific date. It has three sections: assets, liabilities, and shareholders' equity. Those three always obey one rule: assets equal liabilities plus equity. Below, I'll walk you through each section, run five ratios against Apple's real 2025 filing, and show you the seven red flags that tell you to walk away.
I've read a lot of these. Most guides stop after defining the three sections.
That's the part that annoys me.
Because the definitions aren't where the money is. The money is in the footnotes, the ratios, and the stuff that doesn't add up. So that's where we're going.
What a Balance Sheet Actually Tells You (And What It Hides)
Before you read a single number, you need to know what this document is for. A balance sheet is a photograph, not a movie. It captures one moment. The SEC's Beginners' Guide to Financial Statements puts it plainly: balance sheets show what a company owns and owes at a fixed point in time, while income statements and cash flow statements cover a stretch of time. That distinction matters more than almost anything else you'll learn today, and honestly, it's where most beginners get tripped up first.
Here's what that means in practice.
A company can look fantastic on December 31st and be in trouble by February.
The balance sheet won't warn you. It's a snapshot of the reporting date and nothing else. Harvard Business School Online describes the balance sheet as conveying the book value of a business, showing what resources it has and how those resources were financed.
Which brings up the second limitation.
Most assets sit on the books at historical cost, not what they'd fetch today. A warehouse bought in 1998 still shows the 1998 price, minus depreciation, unless there's been a write-down or impairment. So "total assets" is an accounting number, not a market value. Keep that in your back pocket.
Is a Balance Sheet the Same as a Statement of Financial Position?
Yes, and the naming difference trips up a surprising number of readers who open a foreign filing expecting familiar headings. Under IAS 1, the international standard governing presentation, it's called the statement of financial position. Under US GAAP, it's usually just called the balance sheet. Same document, same three sections, different letterhead. If you're reading filings from companies listed in London, Frankfurt, or Karachi, expect the IFRS name.
There's a formatting wrinkle too.
IAS 1 doesn't force a single layout. Assets can be listed current-first or non-current-first. That's why a European filing and an American 10-K can look like different species at a glance. Don't let it throw you.
The Accounting Equation: Why It Always Balances
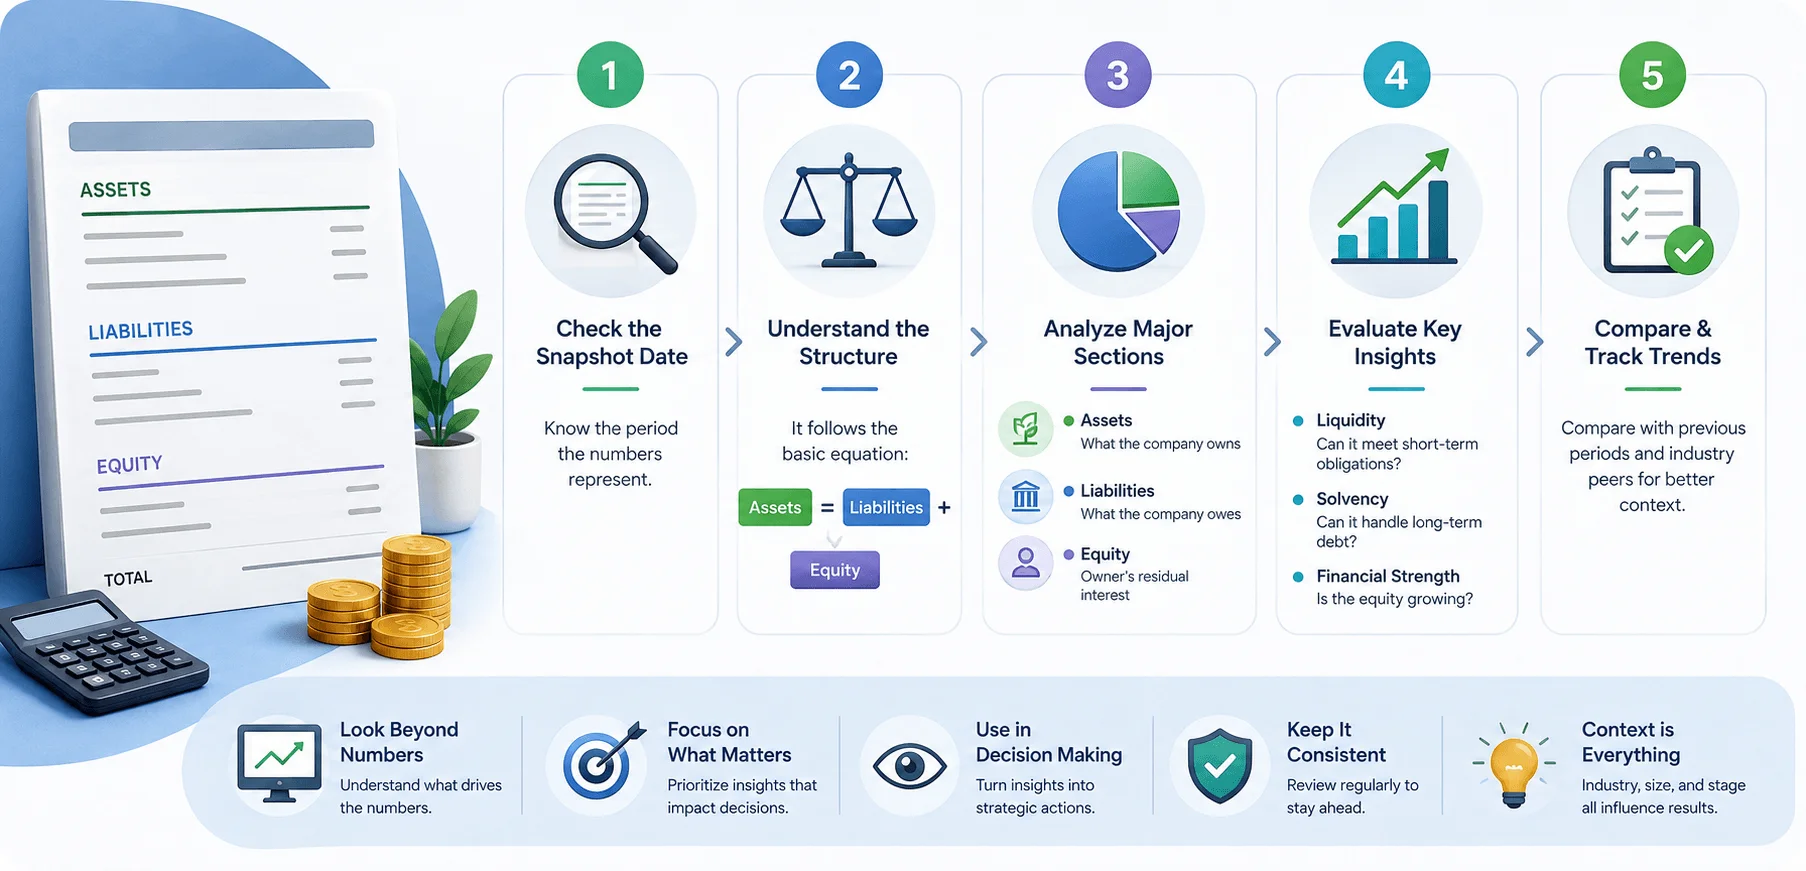
Every balance sheet on earth is built on one equation, and once it clicks, the whole document stops feeling like a wall of numbers. The accounting equation says: Assets = Liabilities + Shareholders' Equity. Read left to right, it's a list of what the business owns. Read right to left, it's a list of who paid for that stuff. Every dollar of resources came from either a lender or an owner. There's no third option, which is precisely why the two sides can never drift apart.
Let me put it in plain English.
You buy a $300,000 house. The bank lends you $240,000. You put down $60,000.
Asset: $300,000. Liability: $240,000. Equity: $60,000.
Balanced. That's it. That's the whole trick, scaled up to a company with 160,000 employees.
If a balance sheet doesn't balance, someone made an error or someone is lying. There is no innocent third explanation.
Step 1: Read the Assets Section
Assets are everything the company owns that carries value, and they're listed in a very deliberate order that you should pay attention to. The sequence runs from most liquid to least liquid, meaning cash sits at the top and things like goodwill sit near the bottom. Under IAS 1, an item counts as current when the company expects to realize, consume, or sell it within its normal operating cycle, which is typically twelve months. Everything else is non-current. That single dividing line does more analytical work than people realize.
Current assets you'll see:
Cash and cash equivalents (the real number, start here)
Marketable securities (short-term investments)
Accounts receivable (money customers owe you)
Inventory (goods waiting to sell)
Prepaid expenses (rent or insurance paid in advance)
Non-current assets you'll see:
Property, plant and equipment (buildings, machinery, vehicles)
Intangible assets (patents, trademarks, licenses)
Goodwill (the premium paid in an acquisition)
Long-term investments
What Is a Contra Asset Account?
A contra asset account is a line inside the assets section that isn't an asset at all, and it catches people constantly because it sits right there among things the company owns. Accumulated depreciation is the classic example. As the Corporate Finance Institute explains, it carries a credit balance and reduces the gross value of fixed assets. It's the running total of every depreciation charge ever recorded against that equipment. Companies show gross PP&E, then subtract accumulated depreciation, to arrive at net book value.
If you only read the top number, you'll badly overestimate how asset-rich the business is.
Other contra assets to watch for:
Allowance for doubtful accounts reduces receivables to what management actually expects to collect.
Reserve for obsolete inventory writes down stock that isn't going to sell.
Both are management estimates. Both can be tweaked. Both are worth checking year over year. If you want the mechanics with journal entries, Wall Street Prep's breakdown covers contra liability and contra equity accounts too.
Step 2: Read the Liabilities Section
Liabilities are claims against the company by everyone who isn't an owner, and they're ordered by when they come due. Current liabilities are obligations payable within twelve months. Long-term liabilities stretch beyond that. This ordering is your early-warning system, because a company drowning in short-term obligations while holding illiquid assets is a company heading for a cash crunch, regardless of how healthy the profit line looks.
The usual suspects on the current side:
Accounts payable (what you owe suppliers)
Accrued expenses (wages and taxes owed but not yet paid)
Deferred revenue (cash collected for work not yet delivered)
Short-term notes payable and the current portion of long-term debt
On the long-term side you'll find long-term debt, bonds, pension obligations, and lease liabilities.
Quick note on deferred revenue, because it confuses almost everyone. Customer cash sitting in your bank account shows up as a liability. Why? Because you still owe them the product. For subscription businesses, a growing deferred revenue balance is genuinely good news wearing a scary costume. (I go deeper on this in our guide to reading the income statement, since that's where the revenue eventually lands.)
For subscription businesses, a growing deferred revenue balance is genuinely good news wearing a scary costume. If you're running the books yourself, the same care applies to routine tasks like knowing how to void a check properly, since sloppy records upstream become messy liabilities downstream.
Don't Skip the Off-Balance-Sheet Items
Some obligations don't appear as line items at all, and those are frequently the ones that matter most to your risk assessment. As Weaver notes in its financial statement review guidance, off-balance-sheet financing through arrangements like certain leases or special purpose entities can obscure a company's true liabilities. You find these in the disclosures, not on the face of the statement. Which is a nice segue.
Step 3: Read the Equity Section
Shareholders' equity is what's left after you subtract every liability from every asset, and it's the section people skim past fastest. That's a mistake. Equity tells you how the company was funded and whether it's been building value or bleeding it. Three components carry most of the signal: paid-in capital, retained earnings, and treasury stock. Read them together and you get a rough history of the company's relationship with its own shareholders.
Common stock and paid-in capital is money raised by issuing shares.
Retained earnings is cumulative profit that was never paid out as dividends. This is the line I check first. A business that's been quietly stacking retained earnings for a decade is a fundamentally different animal from one funding itself through repeated share issuance.
Treasury stock is shares the company bought back. It shows as a negative number.
Here's the calculation, if you want to do it yourself:
Current Retained Earnings = Previous Retained Earnings + Net Income − Cash Dividends − Stock Dividends
And if total equity ever goes negative? Liabilities exceed assets. The company is technically insolvent on paper. That's not a yellow flag, that's a stop sign.
Step 4: Read the Footnotes (The Step Everyone Skips)
The Corporate Finance Institute treats the notes as a fourth major section of the balance sheet, and I'd go further: the notes are frequently more informative than the numbers themselves. They contain the qualitative detail and the assumptions management used. Depreciation methods. Inventory valuation choices. Debt covenants. Pending litigation. Lease commitments. All the context that turns a number into a story.
Nobody reads them. Read them.
I'm serious about this. If a company changed how it values inventory this year, that change lives in the footnotes, and it might explain the entire improvement in gross margin you were about to get excited about.
Step 5: Run the Five Ratios That Matter
Raw balance sheet numbers are close to meaningless in isolation, because $4 million in debt is either trivial or fatal depending on everything around it. Ratios supply the context. These five, drawn from AccountingCoach's ratio guidance and AccountingTools, do most of the analytical heavy lifting. Calculate them across three years rather than one, because the trend line is where the truth usually hides. These same ratios feed directly into any financial model you build for a startup, which is where balance sheet literacy stops being academic.
Ratio | Formula | What it tells you | Rough benchmark |
|---|---|---|---|
Working capital | Current Assets − Current Liabilities | Cash cushion for next 12 months | Positive, in most industries |
Current ratio | Current Assets ÷ Current Liabilities | Short-term solvency | Above 1.0 is the floor |
Quick ratio | (Cash + Securities + Receivables) ÷ Current Liabilities | Liquidity without selling inventory | Above 1.0 is healthy |
Debt-to-equity ratio | Total Liabilities ÷ Shareholders' Equity | Financial leverage and shareholder risk | Under 1.0 is conservative; 1.0–2.0 common; 2.0–3.0 normal for utilities and telecoms |
Debt-to-asset ratio | Total Liabilities ÷ Total Assets | How much creditors funded | Lower is safer |
Should You Read the Current Ratio or the Quick Ratio?
Read both, then measure the gap between them, because that gap is the single most useful thing on this list and almost nobody teaches it. The current ratio counts all current assets. The quick ratio strips out inventory. So the distance between the two numbers tells you exactly how much of a company's apparent liquidity depends on selling stock that may or may not move.
A current ratio of 2.5 alongside a quick ratio of 2.1 means the liquidity is real and mostly cash-like.
A current ratio of 2.5 alongside a quick ratio of 0.9 means inventory is doing all the work, and inventory only helps if somebody buys it.
Same headline ratio. Completely different risk profile.
Do the same pairing with debt-to-equity and the interest coverage ratio. High leverage with strong coverage is a financing strategy. High leverage with weak coverage is a countdown.
A Real Balance Sheet Example Explained: Apple, FY2025
Enough theory. Let's read an actual filing, because balance sheet example explained posts that use invented numbers teach you nothing about the messiness of real reporting. Below are figures straight from Apple's fiscal 2025 Form 10-K, filed with the SEC for the year ended September 27, 2025. All numbers are in millions of US dollars.
Line item | FY2025 | FY2024 |
|---|---|---|
Cash and cash equivalents | $35,934 | $29,943 |
Marketable securities (current) | $18,763 | $35,228 |
Accounts receivable, net | $39,777 | $33,410 |
Inventories | $5,718 | $7,286 |
Total current assets | $147,957 | $152,987 |
Property, plant and equipment, net | $49,834 | $45,680 |
Total assets | $359,241 | $364,980 |
Accounts payable | $69,860 | $68,960 |
Total liabilities | $285,508 | $308,030 |
Total shareholders' equity | $73,733 | $56,950 |
Now let's do the math together.
Check the equation first. $285,508 + $73,733 = $359,241. Matches total assets exactly. The statement balances.
Working capital: $147,957 − $165,631 = negative $17,674 million.
Wait. Negative?
Yes. Apple's current liabilities exceed its current assets by roughly $17.7 billion. Current ratio: 0.89. Textbook rule says anything under 1.0 is a liquidity warning.
Quick ratio: ($35,934 + $18,763 + $39,777) ÷ $165,631 = 0.57.
Debt-to-equity ratio: $285,508 ÷ $73,733 = 3.87.
By the benchmarks in the table above, those numbers look alarming. A current ratio below 1.0 and a D/E near 4.0 would be genuine distress signals at most companies.
So Why Isn't Apple in Trouble?
Because ratios are questions, not verdicts, and this is the lesson that separates people who memorize formulas from people who can actually analyze a business. Apple carries an additional $77,723 million in non-current marketable securities that the current ratio ignores entirely. It also generates enormous operating cash flow and holds negotiating power over suppliers, which lets it stretch accounts payable ($69,860 million) far longer than a smaller firm ever could. Low working capital here reflects dominance, not fragility.
Compare that to a struggling retailer with the same 0.89 current ratio and no cash generation.
Identical number. Opposite meaning.
That's why you never stop at the ratio. That's why you never stop at the ratio. Always ask what's funding the gap. Like any analysis, the first step in the decision-making process is defining the actual question, not rushing to the number.
Also notice equity jumped from $56,950 million to $73,733 million year over year. That's the kind of trend that only shows up when you pull two years side by side, which every 10-K gives you for free.
The 7 Red Flags to Watch For
Once you can read the three sections, the next skill is spotting when something's wrong, and these patterns show up again and again in companies that later collapsed. The American Association of Individual Investors recommends going beyond the statements into the 10-K and 10-Q filings, and watching for earnings restatements, CFO turnover, and auditor going-concern warnings. Those three together are about as loud as a warning gets.
Here's my working list:
Negative shareholders' equity. Insolvent on paper.
Receivables growing faster than revenue. Sales aren't converting to cash, or credit terms got loose.
Inventory growing faster than sales. Product isn't moving.
Rising debt with flat or falling cash. Borrowing to fund operations, not growth.
A sudden spike in accounts payable. Possibly stretching suppliers because cash is tight.
Ballooning goodwill and intangibles. Overpaid acquisitions become future write-downs.
Net income rising while operating cash flow falls. The single most reliable warning in all of financial analysis.
That last one deserves its own paragraph. WorldCom misclassified billions in operating expenses as capital expenditures, which made the balance sheet look stronger and the debt burden look lighter than it was. The income statement looked terrific. The cash never showed up. Then the company filed for bankruptcy in 2002.
Profit is an opinion. Cash is a fact.
Balance Sheet vs Income Statement vs Cash Flow Statement
You can't judge a company from the balance sheet alone, and anyone telling you otherwise is selling something. The three core statements answer three different questions, and they only tell the full story when you read them side by side. The balance sheet gives position, the income statement gives performance, and the cash flow statement gives the reality check between the two.
Statement | Question it answers | Time frame | Key line to check |
|---|---|---|---|
Balance sheet | What do we own and owe? | One specific date | Shareholders' equity |
Income statement | Did we make money? | A period | Net income |
Cash flow statement | Did cash actually move? | A period | Operating cash flow |
Read them in that order, then circle back. Compare net income to operating cash flow. If those two diverge and keep diverging, something in the accounting deserves your suspicion.
How to Read a Balance Sheet: Practice on Real Filings
Reading about balance sheets and reading actual balance sheets are different skills, and the second one only develops with reps. Every US-listed public company files its financials with the SEC, and they're free. Go to EDGAR full-text search, type in a company name, and open the most recent 10-K. The balance sheet lives in Item 8, alongside the income statement and cash flow statement. Pick a business you actually understand, because domain knowledge makes the numbers mean something.
Your first pass will be slow. Fine.
Do three companies in the same industry and something clicks. You stop reading numbers and start noticing which one is carrying too much debt, which one is sitting on lazy cash, which one is quietly compounding. Pair this with our walkthrough of essential financial ratios and you'll cover most of what a junior analyst does in week one.
Frequently Asked Questions
Below are the questions readers ask most often about how to analyze a balance sheet, answered directly so you can skip the hunting.
What are the three main parts of a balance sheet?
Assets, liabilities, and shareholders' equity. Assets are what the company owns, liabilities are what it owes to outside parties, and equity is the residual value belonging to owners. All three appear on every balance sheet regardless of country or accounting standard.
Why must a balance sheet balance?
Because every asset was funded by either a creditor or an owner, so the total of liabilities plus equity always equals total assets. If the two sides don't match, there's either a bookkeeping error or deliberate misstatement.
What is the difference between a balance sheet and an income statement?
A balance sheet shows financial position on one specific date, while an income statement shows performance across a period such as a quarter or year. The balance sheet answers "what do we have," and the income statement answers "how did we do."
What does a good balance sheet look like?
A strong balance sheet typically shows positive working capital, a current ratio above 1.0, growing retained earnings, and debt levels the company's earnings can comfortably service. Context matters more than absolutes, since capital-intensive industries carry higher debt normally.
What is a healthy current ratio?
Above 1.0 is generally considered the minimum, and 1.5 to 3.0 is comfortable for most industries. Very high ratios can signal idle cash, while ratios below 1.0 require examining cash generation before concluding there's a problem.
What does negative shareholders' equity mean?
It means total liabilities exceed total assets, making the company technically insolvent on paper. This can result from accumulated losses or aggressive share buybacks, and it warrants serious investigation before investing.
Where can I find a public company's balance sheet?
Use the SEC's EDGAR database for US-listed companies and open the annual 10-K filing, where financial statements appear in Item 8. Most companies also publish them in the investor relations section of their website.
What is working capital and how do I calculate it?
Working capital equals current assets minus current liabilities, and it measures the cash cushion available for the next twelve months. Positive working capital means short-term resources cover short-term obligations.
What are the biggest red flags on a balance sheet?
Negative equity, receivables or inventory growing faster than revenue, rising debt with falling cash, and net income diverging from operating cash flow. Auditor going-concern warnings and frequent CFO turnover compound all of these.
Is a balance sheet audited?
For public companies, yes. Annual financial statements in the 10-K are audited by an independent accounting firm, while quarterly statements in the 10-Q are reviewed but not fully audited.
Final Thoughts
Knowing how to read a balance sheet is less about memorizing line items and more about developing a sequence you run every time: check the equation, scan the assets, weigh the liabilities, examine equity, read the footnotes, then run your ratios. The Apple example above shows why that last step needs judgment attached. A current ratio of 0.89 means one thing at a cash machine and something very different at a struggling retailer.
Open a 10-K this week. Pick a company you already understand.
Run the five ratios. Compare two years. Read the footnotes.
Do it three times and this stops being a skill you're learning and starts being one you have.